Merlin
Turning engineering pushback into a phased plan, and a presentation maker that takes 45 minutes instead of most of a day.
- Problem
- Customer success teams spent about 6 hours building each customer presentation, and engineering pushed back on a redesign too big to ship in one release.
- Solution
- I mapped impact against effort with engineering, shipped the fixes users needed most first, and kept the full redesign as the north star for later phases.
- 6h → 45maverage time to build one customer presentation
- ~88%less time per presentation
- ~26hsaved per person each month
- ~8 weeksof work time back per person each year
Estimated, based on about 5 presentations per person per month.
-
 01 Understand CSM needs and stakeholder goals
-
 02 Sketch One screen for everything a CSM needs
-
 03 Explore Two directions for each hard problem
- 04 Prioritize Impact vs. effort, with engineering
-
 05 Learn Three lessons from early ideas
-
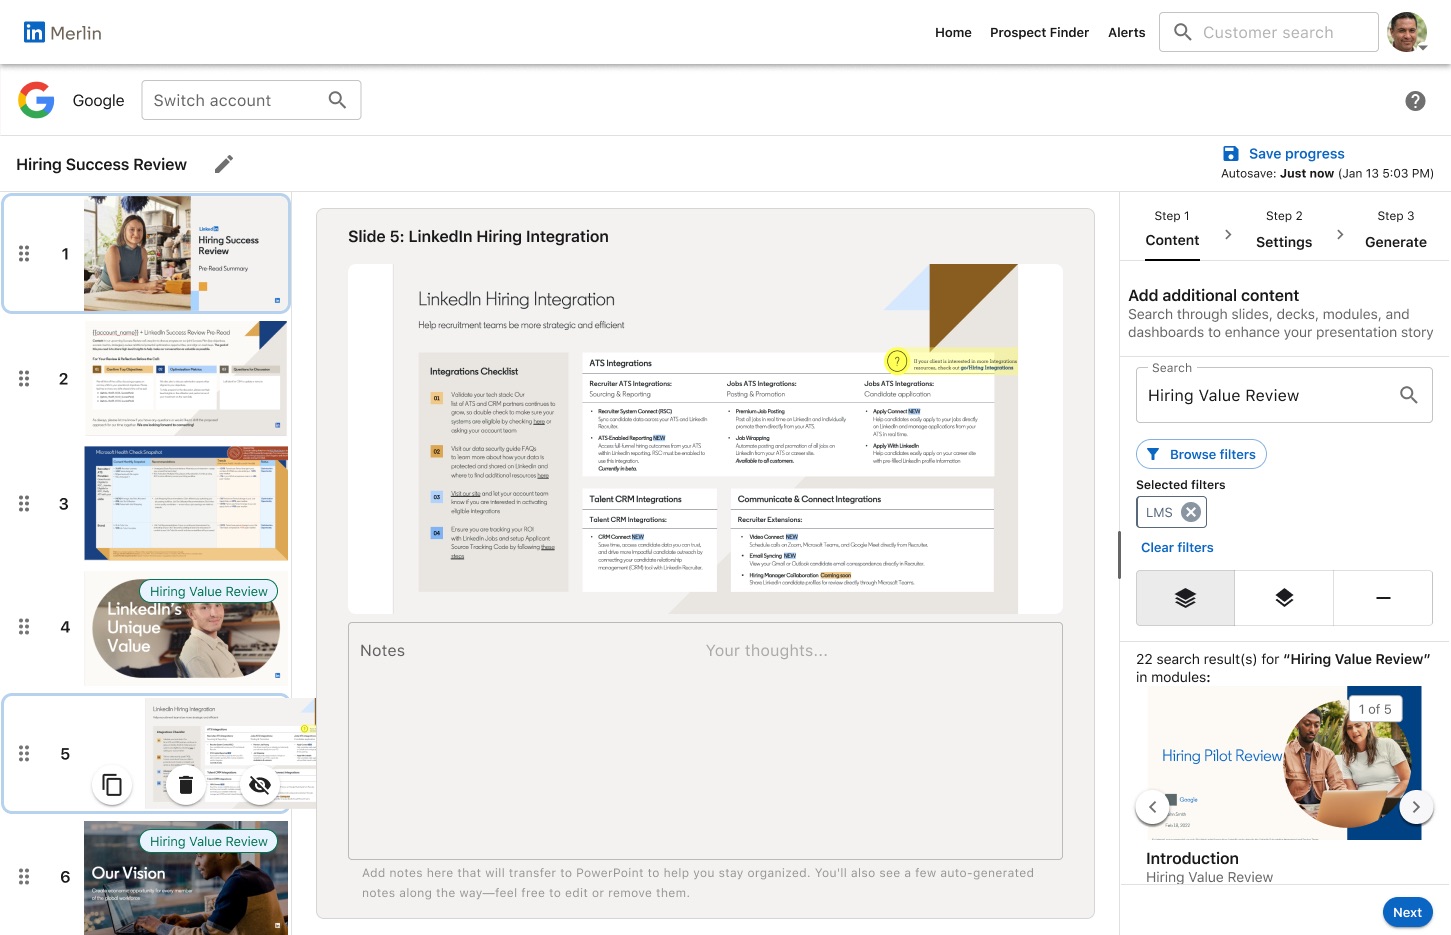 06 Prototype Figma Design and Figma Make
-
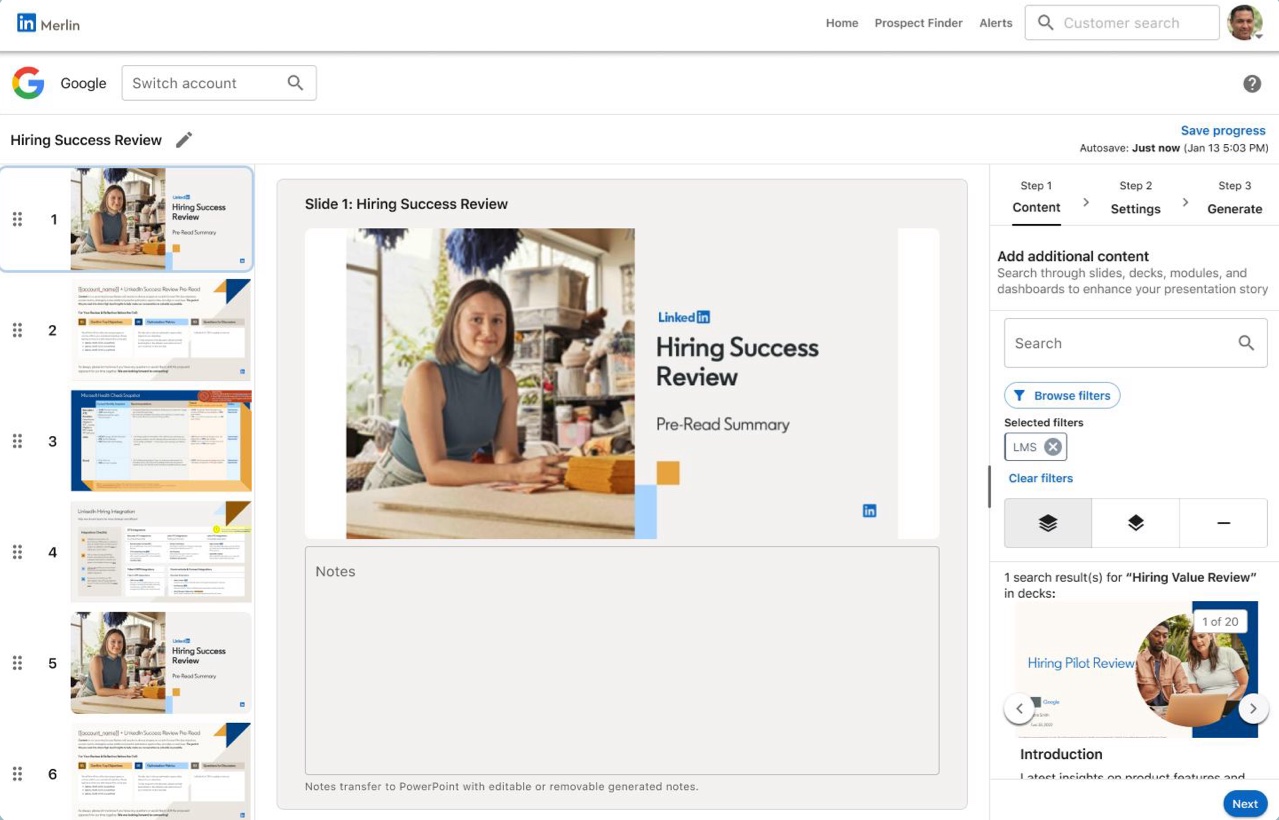 07 Ship P0 first, north star kept
The problem
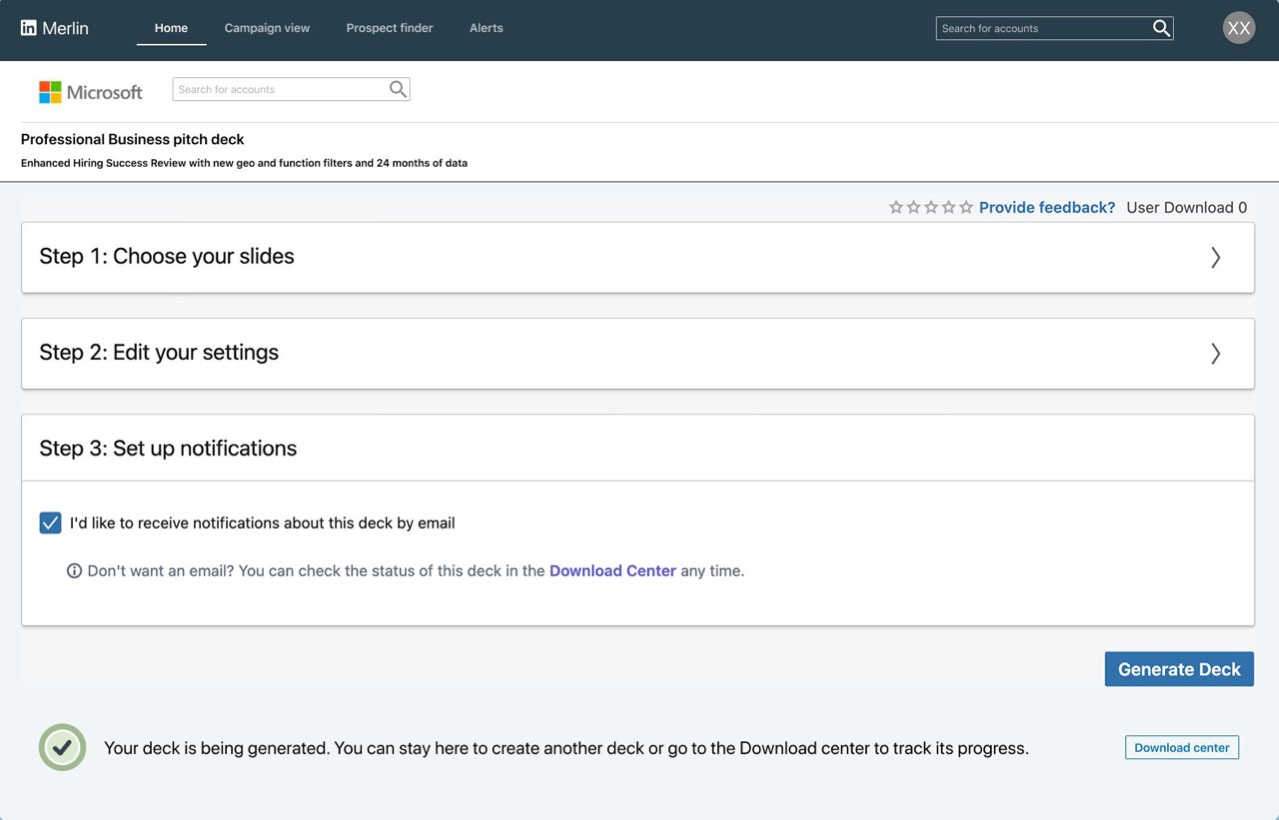
Customer success managers (CSMs) build presentations that show business customers how their LinkedIn products are performing.
Merlin has two audiences, and I designed for both. The Insights team builds the variables, and CSMs see those variables as the settings they fill out in step 2.
- Insights teamBuild the variables that show up in the step 2 settings
- Customer success managersFill out the settings in step 2 and build the presentationAbout 5,000 people
- ~6 hoursto build one deck, on average
- Frequent errorsin finished presentations
- PowerPointfor the finishing touches, by hand
- One sourceof presentation content at a time
Brainstorming
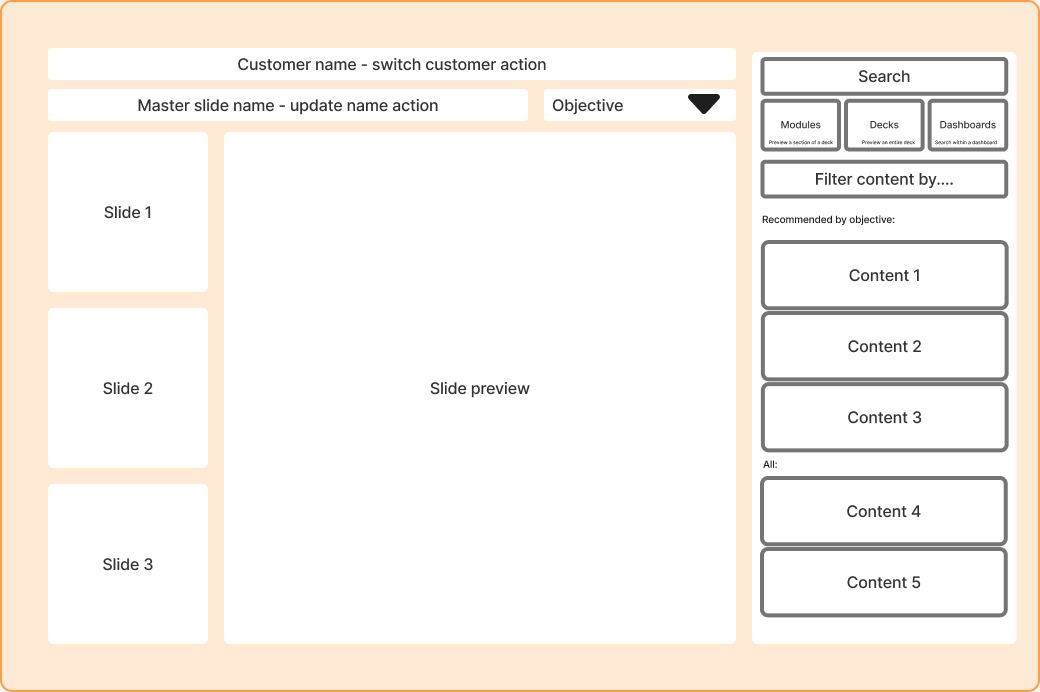
I started with one screen that held everything a CSM needed, then sketched in pairs with teammates.
- ModulesChapters
- Fixed side panelsExpandable panels
- Every content type alikeDistinct looks per type
- No explanationDescriptions for new reps
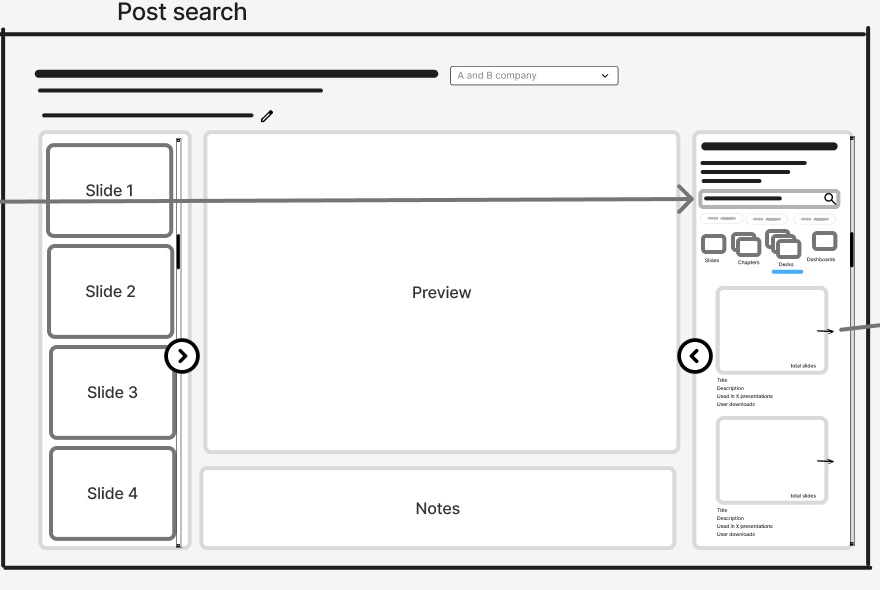
How do CSMs find content to add?
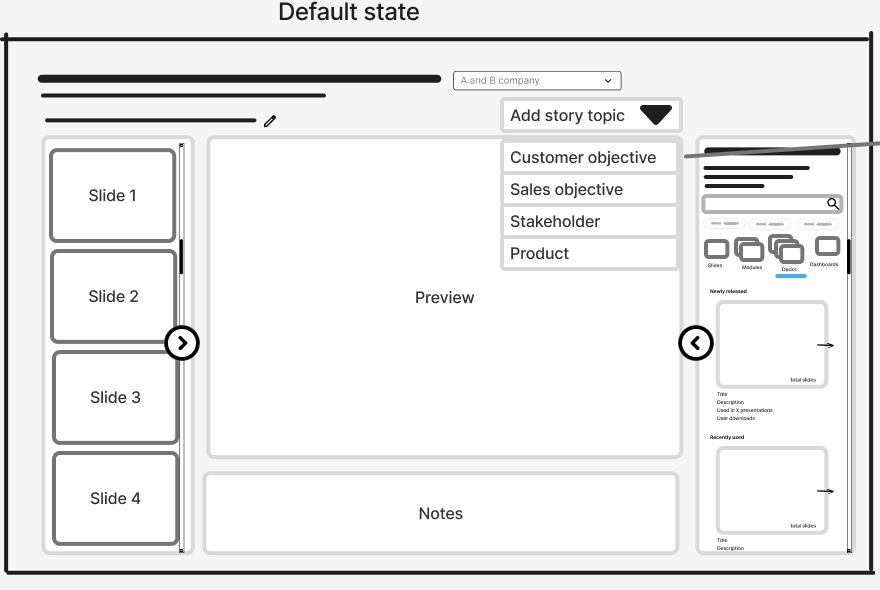
CSMs choose a story topic, such as a customer objective like hiring, and the content panel recommends decks and slides for it.
Explored, not the final direction CSMs search across slides, chapters, decks and dashboards, and each result shows a description and how often it's used.
Became the final designHow do settings apply across a deck?
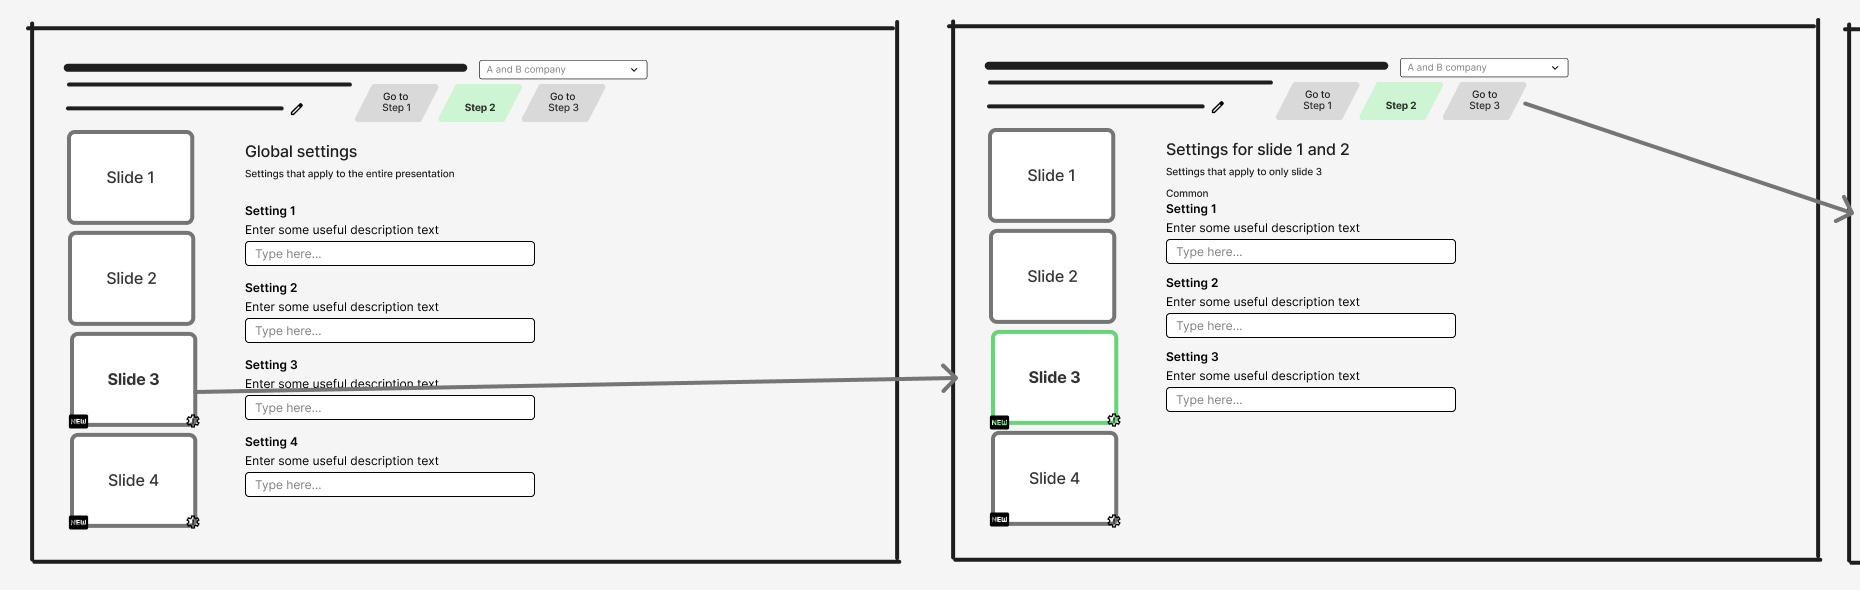
Global settings apply to the whole presentation, and selecting a slide opens settings for that slide only. In the final design, deck settings apply to every slide unless a slide has its own.
Became the final design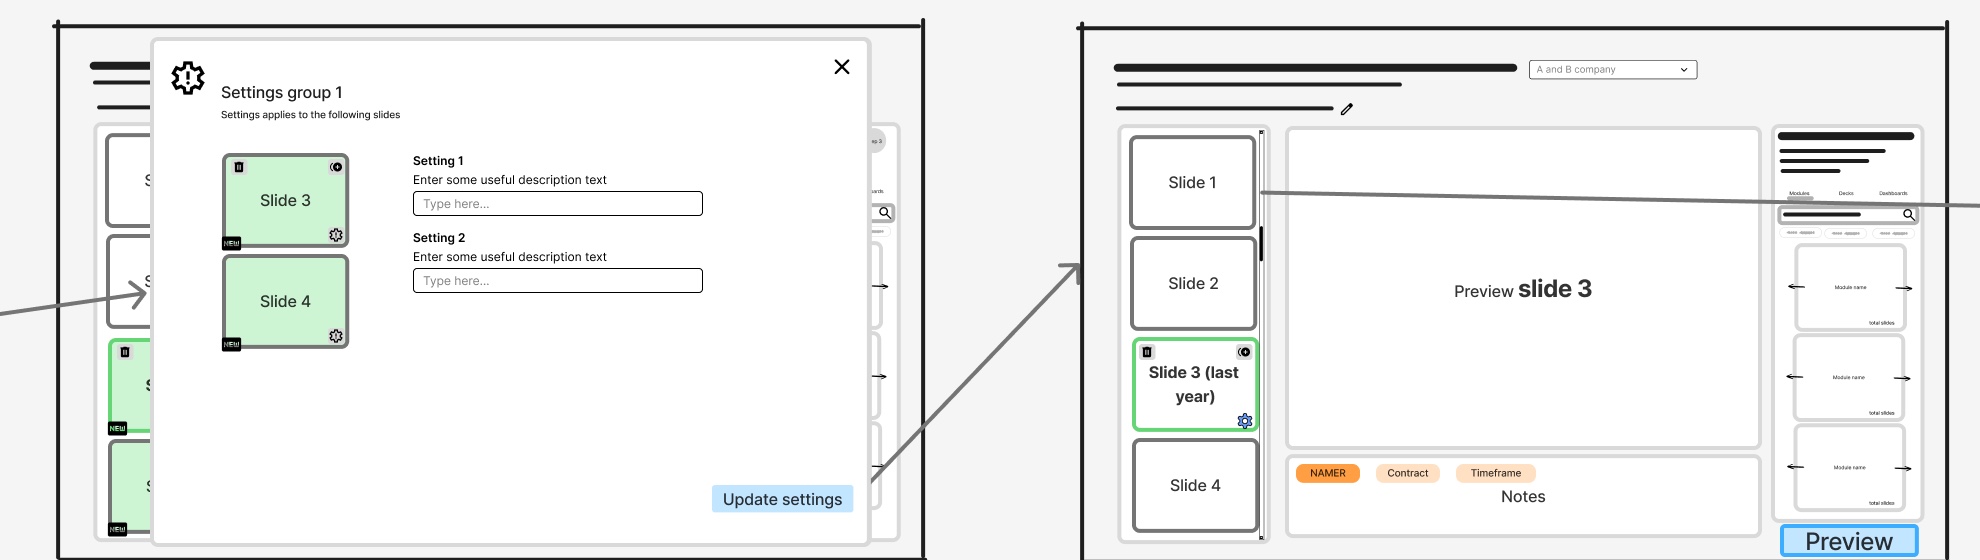
CSMs select several slides, apply settings to them as a group in a pop-up, and the settings appear as tags on the slide.
Explored, not the final directionThe pushback
Prioritizing with engineering
Instead of defending the design, I sat down with engineering, learned where the cost was, and we mapped every feature together.
Shipped first · P0
- Clone slidesUsers needed to clone a slide and add their own data to it, to compare things like regional numbers side by side.
- Custom settings per slideCloning only worked if each slide could have its own settings. Both answered the same need, so they shipped together.
- Notes that carry into PowerPointNotes travel with the deck, so people can see what to do next without having to remember it.
- Live data previewShowing real data in step 2 let people see the actual slides before downloading.
Moved to a later phase · P1
- AI featureHeld for P1 so the first release could focus only on building presentations.
- Customer pages and researchThese phases of the project were also held for P1, for the same focus on presentation creation.
- Dashboard data sourceHeld for P1 until we learned more about how people used it.
Small polish
- Tutorial you can reopenA short intro eased CSMs from the old Merlin into the new studio, and they could open it again any time.
- Clearer Next buttonIn testing, CSMs weren't sure when to move on to step 2. Turning on the Next button once the required steps were done made the next move clear.
- Resizable side panelCSMs wanted a bigger settings panel but still needed to see their slides. A panel they can resize covers both.
Left out for now
- Blank slideA blank slide to customize in PowerPoint. Left out because few people needed it.
One of her standout strengths is her ability to prioritize effectively while maintaining clarity around the broader platform vision.
Ana Luiza Loures Pinto, insights manager, Merlin
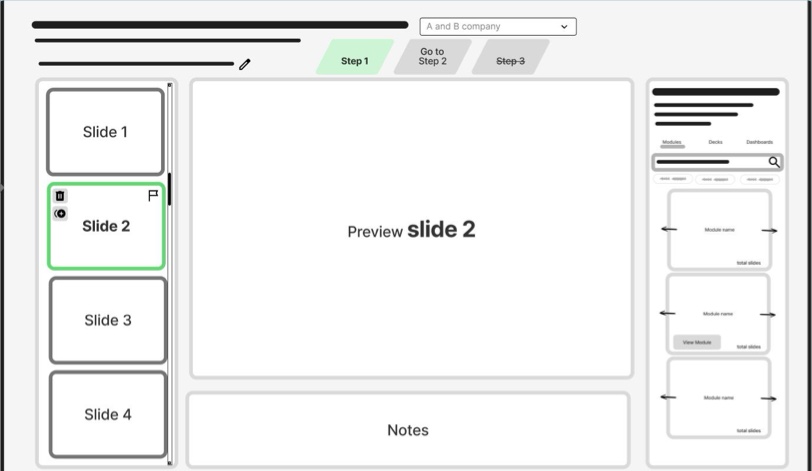
What early ideas taught us
- Lesson 1 Show changes as they happen
CSMs need to see their slides update as they change settings in step 2, so the middle pane had to stay visible throughout the experience.
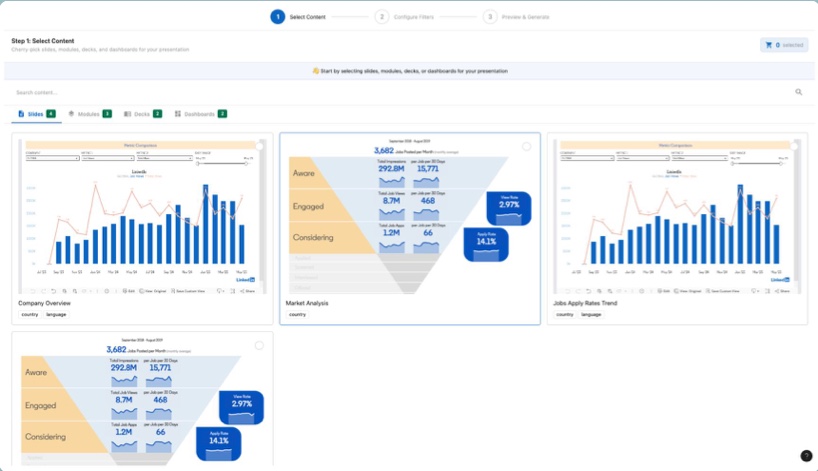 The idea: a shopping cart.CSMs would browse a library of content, pick and choose what they wanted, then start customizing. But browsing took over the screen and hid the slides.
- Lesson 2 Make the next step obvious
Without a clear call to action, CSMs didn't know when to move on. Navigation moved into the right panel, and Next turns on once the required steps are done.
The idea: a stepper you can jump around in.Instead of Back and Next, CSMs could click any step, so going from step 3 to step 1 took one click instead of two. But nothing showed when they were ready to move to step 2. - Lesson 3 Let people make room
Some settings needed more space than a side panel gives. Instead of a full-screen takeover, the right panel became resizable, so CSMs widen it only when they need to.
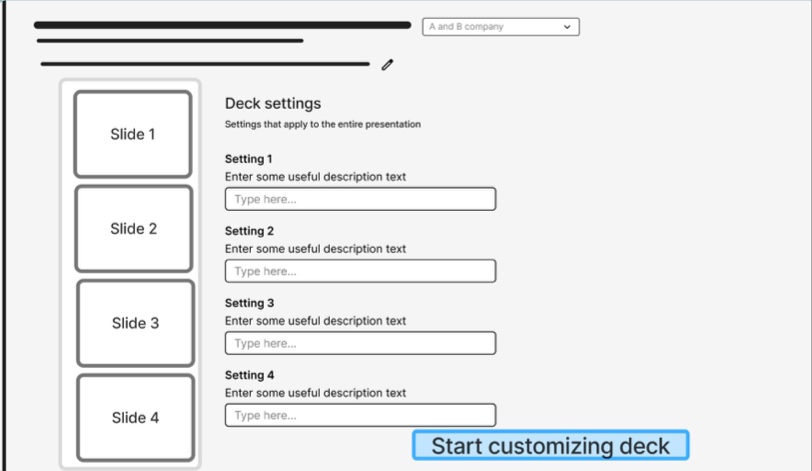 The idea: full-screen settings.Step 2 settings can be long, and the right panel is small. My theory was that CSMs would check their changes in step 3, so settings could take over the whole screen while they filled them in. In practice, they wanted to see the slides update as they went.
I checked these fixes with a quick wireframe in front of the user group before polishing.
Watch it
Watch a CSM build a deck in the MVP, step by step.
Read the steps instead
- Search for content to add by typing Hiring Value Review. One panel searches slides, chapters, decks and dashboards.
- Show the results as modules.
- Select slide 4, so new slides land after it.
- Scroll the results and add a module.
- Add the selected slides after slide 4. Flag icons mark slides that may need updates in PowerPoint.
- Drag slide 4 below slide 5 to reorder them.
- Hover over slide 5 for quick actions.
- Duplicate slide 5 (P0). CSMs clone a slide and add their own data, to compare things like regional numbers.
- Add a note to slide 5: I want this one to show NAMER data (P0). Notes carry into PowerPoint, so CSMs see what to do next without having to remember it.
- Go to step 2: Settings.
- Drag the panel edge to make room for settings. Settings can be long, and the panel widens without hiding the slides.
- Fill in the deck settings. They apply to every slide unless a slide has its own.
- Select slide 5.
- Give slide 5 its own country (P0). Custom settings per slide make cloning useful.
- Slide 5 now shows Custom settings applied. Go to step 3.
- Check the preview, then generate (P0). CSMs see the actual slides before downloading.
- Open the Presentation library.
- The deck is generating in the Presentation library.
- 1Every flow
- 2New terms
- 3Tone
- 4Edge cases
- 5Navigation
The outcome
BeforeAfter 26h back every month, per person
Average time per deck went from 6 hours to 45 minutes, about 88% faster and well past the 2-hour goal. Engineering got the time to build the complex features properly in later phases.
- P0 · Shipped Presentation creation
- Clone slides
- Custom settings per slide
- Notes that carry into PowerPoint
- Live data preview
- P1 · Planned The hard parts
- AI feature
- Customer pages
- Research phases
- Dashboard data source
- After · Next An AI agent in Merlin
- Customer research
- Note-taking
- Content suggestions
- North star · Target The full redesign
- The complete design every phase works toward
Pushback is information. Once I understood the why, we found a path that protected both the user experience and the engineering timeline.